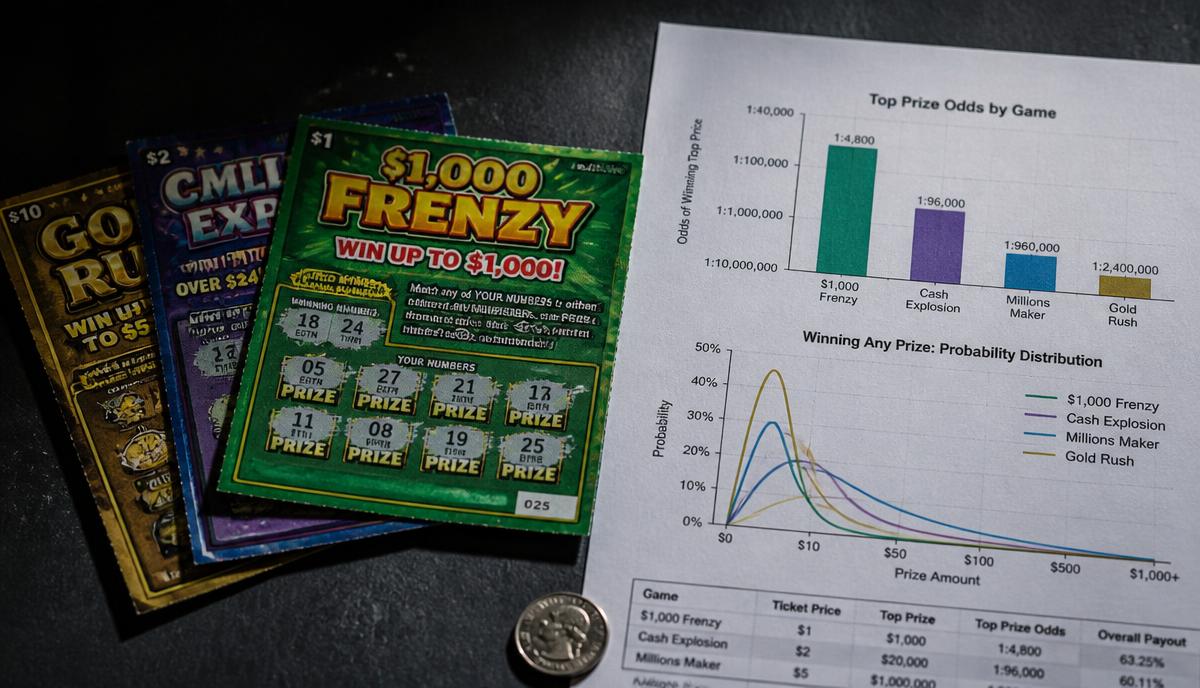
WCNC in Charlotte ran a segment titled “This algorithm helps you find winning scratch-off lottery tickets.” (watch it here). A reporter walks through a handful of websites that rank instant games using the remaining-prize data state lotteries publish, then goes out, buys one ticket from several different games, and scratches them on camera to see whether the “algorithm” worked.
It’s a good-faith piece, and the sites it features are doing something legitimate. But the on-air test is built on a sampling method that cannot answer the question it asks. Below is what those sites get right, where the report goes wrong, and how ScratcherStats handles the same data differently.
What the featured sites do well
Every site in the segment starts from the same public source: state lotteries are required to publish how many prizes at each tier remain unclaimed for each active game. From that, you can compute something more useful than the odds printed on the back of the ticket, because printed odds describe the game at print time, not the game as it exists on the shelf today after months of claims.
So the shared idea is sound:
- Pull the remaining-prize table for every active game.
- Estimate how many tickets are still unsold.
- Re-derive current odds and expected value from what is actually left.
- Rank the games.
Where those sites tend to stop is at a single static number — a rebuilt expected value or a “prizes remaining” percentage — and then sort by it. That number is an average over an infinite number of tickets. It tells you nothing about what happens to a real person who buys five tickets on a Saturday.
Where the report’s test breaks down
1. One ticket per game is a sample size of one
The reporter buys a single ticket from each of several ranked games. With overall odds usually around 1 in 3 to 1 in 4 — and profit odds (a prize worth more than the ticket cost) often closer to 1 in 8 or worse — a single ticket is overwhelmingly likely to lose no matter how good the game is. Scratching one ticket and finding a loser is the expected outcome for almost every game in every state. It is not evidence about the ranking.
Put numerically: if a ranked game has a 12% chance of a profit prize per ticket and a bottom-ranked game has an 8% chance, a one-ticket test tells them apart essentially never. You need dozens of tickets before the difference becomes visible above the noise.
2. Spreading one ticket across many games maximizes variance
Buying one ticket each from six different games is the highest-variance way to sample. Instant games are not independent coin flips: prizes are distributed through printed packs, so consecutive tickets from the same pack carry information. Buying a cluster from one game gives you exposure to a pack’s prize structure. Buying one ticket from six games gives you six isolated draws from six different pools and no exposure to any of them.
3. “Algorithm” implies a guarantee that no data can provide
No ranking makes a scratch-off a positive expected-value purchase. State lotteries keep roughly 30–40% of instant-ticket sales; every game has a negative expected value by design. What the data can do is show you which games currently return more of the pool than others, and how much variance to expect along the way. Framing that as an algorithm that “finds winning tickets” sets up a test the data was never going to pass.
How ScratcherStats handles this differently
ScratcherStats starts from the same public remaining-prize data, then does the step the other sites skip: instead of reporting a single average, it runs a Monte Carlo simulation on every active game, every night, in all 26 states that publish tier-level prize counts.
- Simulated in clusters, not singles. Each nightly run draws 500 tickets per game in clusters of 20–50 — the way an actual buyer plays — rather than assuming one infinitely divisible ticket.
- Profit is defined strictly. A prize equal to the ticket cost is a loss, not a win. Most sites count any prize as a “win,” which inflates every game.
- Variance is reported, not hidden. Expected and observed longest losing streaks, cluster cost, and a probability-weighted potential prize per ticket appear next to every game.
- Freshness is enforced. Games that stop appearing in a state’s published feed are dropped instead of lingering with stale numbers.
The strategy the report should have tested
If you want to evaluate whether current prize data carries signal, the sound version of the reporter’s experiment looks like this:
- Pick one game, not six. Sort your state’s games by simulated probability of a profit prize on the ScratcherStats home page and take the top game at a price you’re comfortable with.
- Buy a cluster, not a single. The cluster size shown on each card is the number of tickets the simulation used. That is the sample size at which the ranking is meaningful.
- Check the cluster cost first. Cluster cost is ticket price × cluster size — the total spend of the test. Decide whether that number is money you are willing to lose entirely, because it very often will be.
- Expect the losing streak. The expected longest losing streak tells you how many consecutive non-winners are normal within a good game. Seeing them is not evidence the ranking failed.
- Judge the outcome against the distribution, not against “did I win.” The simulation gives a probability of profit, not a promise.
Run that test and you are actually measuring something. Run the one-ticket-per-game version and you are measuring luck, then attributing the result to the data.
The honest bottom line
The report is right that this data exists, is public, and is underused. It is wrong to treat a six-ticket scratch session as a verdict on it. Better data changes the shape of the odds; it does not change the sign of the expected value. Scratch-offs remain a negative-EV form of entertainment, the house margin is structural, and no site — including this one — can make a game profitable.
What ScratcherStats can do is show you exactly how negative, how volatile, and how much of the prize pool is still on the table — and do it at the sample size where those numbers actually mean something.