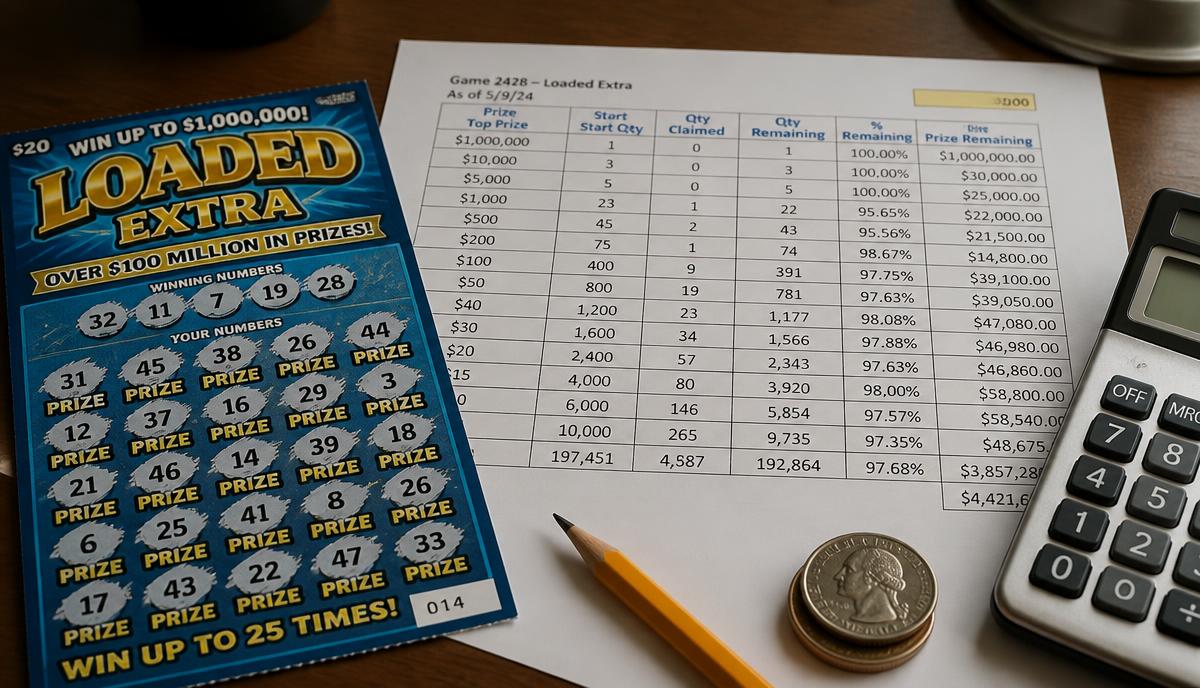
Scratch-off odds are not discovered after the fact — they are designed before a single ticket is printed. A lottery decides how many tickets to print, at what price, and exactly how many winners of each prize amount go into that print run. Everything you see on a ticket back (overall odds, top prize odds) falls out of that one spreadsheet.
This article uses ScratcherStats' live prize-structure data — every prize tier for roughly 2,400 active games across the 26 states we track — to answer four questions: how the odds get set, whether cheap games really are worse deals, what margin the lottery designs in, and how much prize money is still unclaimed when a game winds down.
How the odds are actually determined
A game design starts from three inputs:
- Ticket price ($1 through $50, occasionally $100).
- Print run size — how many tickets will exist, often in the tens of millions.
- Target payout percentage — the share of gross sales the lottery intends to return as prizes.
From there the designer distributes the prize budget across tiers: one or a handful of top prizes, a thin layer of mid-tier prizes, and a very large number of small prizes at or just above the ticket price. Overall odds are simply total winning tickets ÷ total tickets printed. Top-prize odds are total tickets ÷ number of top prizes. Nothing is random about the structure; only the shuffling of tickets into packs is.
The number of small, near-cost prizes is the lever designers pull hardest. Those prizes make the game feel generous — they keep the overall odds around 1-in-3 or 1-in-4 — while costing very little of the prize budget. That's why ScratcherStats separates any prize from a profit prize (a prize strictly greater than the ticket cost). A $5 win on a $5 ticket counts as a win in the lottery's marketing and as a loss in your wallet.
The payout percentage by price tier
Here is the designed payout — total prize dollars printed ÷ total ticket sales if the full run sells — for every price tier we track.
The pattern is consistent and steep: $1 games return about 62% of sales as prizes, while $30 and $50 games return roughly 79–80%. That is an 18-point spread, and it is the single most reliable rule in scratch-off design.
So do cheap games subsidize expensive ones?
Effectively, yes — though "subsidize" is the wrong frame. Flip the payout numbers around and you get the lottery's designed gross margin per price tier.
The lottery keeps an average of roughly 39% of every dollar spent on $1 tickets, versus about 20% on $50 tickets. Three things drive that gap:
- Fixed costs per ticket. Printing, distribution, and the retailer's commission (typically 5–6% of the sale) cost about the same on a $1 ticket as on a $30 ticket. On a $1 ticket that overhead is a huge slice of revenue, so the prize budget has to shrink.
- Price insensitivity at the low end. Casual buyers grabbing a $1 or $2 ticket at the register are not comparing payout percentages. Players buying $30 tickets often are, and they have alternatives.
- Volume economics. High-price games need a strong payout to justify the outlay and keep repeat players engaged; low-price games sell on impulse and top-prize marketing.
Note the spread within each tier, shown in the table above. Margin varies a lot game to game — the standard deviation is around 8 points at most price tiers — so "buy the $30 game" is a tendency, not a rule. Individual games at the same price can differ by 20 points of payout, which is exactly why we rank games individually rather than by price.
Do lotteries target a specific profit percent?
They target a payout percent, and the margin follows. Some states set a statutory minimum prize payout for instant games; others leave it to the lottery board's game-design rules. For example, Minnesota requires that prizes for games that do not require an online terminal connection — i.e., scratch-off games — equal at least 60% of gross receipts from those games in any fiscal year (Minn. Stat. § 349A.10, subd. 2(b)(2)). A 2001 Florida Office of Program Policy Analysis & Government Accountability (OPPAGA) review found that the "optimum payout on instant tickets is around 65%," though at that time the Florida Lottery's statutory requirement was to return approximately 50% of gross revenue as prizes (Fla. H. Bill 23 analysis, 2002). Many lotteries simply design each prize structure to land near a board-approved payout range rather than a single fixed number.
That gross margin is not state profit. Out of it come:
- Retailer commissions (roughly 5–6% of sales, plus cashing bonuses)
- Ticket printing and distribution
- Advertising and administration
- Vendor fees for the gaming system
What's left is the transfer to the state's beneficiary fund — education, veterans' services, general revenue, depending on the state. Across the industry that net transfer typically lands in the 20–30% range of total sales, which lines up with the gross margins above minus operating costs.
How this relates to expected value on ScratcherStats
The payout percentage above is the lottery's designed return at the start of a game: prize dollars printed ÷ sales if every ticket sells. The expected value we show on each game card is different and more useful to a player — it's computed from remaining prizes against remaining tickets, so it moves every day as prizes get claimed.
That's why a game can start at a 72% payout and drift meaningfully above or below it. Sell a top prize early and the remaining expected value drops; leave two top prizes sitting in a nearly sold-out run and the remaining expected value climbs. Our nightly simulations sample from the live remaining-prize distribution for precisely this reason — the designed number tells you about the lottery's business, the remaining number tells you about your next ticket.
How much prize money goes unclaimed?
A meaningful share of printed prize money is never collected. Tickets get lost, thrown away, or scratched and misread; small prizes go unredeemed constantly; and occasionally a top prize expires. Every state has a claim deadline (typically 90 days to one year after the game closes), and unclaimed money usually reverts to the beneficiary fund or a future prize pool.
We can measure the tail end of this directly. State feeds drop games once claim periods close, so the closest observable proxy for "end of game" is a game that has sold nearly all of its prize inventory. Here's where those games stand.
For games that are effectively finished — under 5% of their printed prizes still outstanding — the average share of prize dollars still unclaimed is around 3%, with a standard deviation of roughly 1.4 points and a range from about 0.5% to 8%. On a game that printed $40 million in prizes, that's on the order of $1.2 million left on the table.
Two caveats worth stating plainly. First, "remaining" in state data means unclaimed, not unsold — some of that money is sitting in tickets still on a retailer's rack, and some is in a drawer at home. Second, the top-prize picture is noisier than the average: among the near-finished games in our snapshot, a majority still had at least one top prize unclaimed. That's part of why we flag games whose top prize is already gone — and why a game with prizes left but almost no inventory is a very different bet than one with a full rack.
What this means for buying
- Higher price tiers genuinely return more per dollar. If you're comparing $1 versus $30 purely on designed payout, the $30 game wins by roughly 17 points.
- Within a price tier, individual games vary enough that the tier average shouldn't decide it for you. Check the current rankings for your state.
- Every game is a negative-expectation bet. The best you can do is choose the least negative one, and the designed payout table shows exactly how much room there is between the worst and best options.
Related reading: