
We’ve been studying the secrets behind the Virginia Lottery Scratcher system to really understand the ways the Average Joe can maximize his chances. Here’s some tips you should remember before you buy any lottery scratcher:

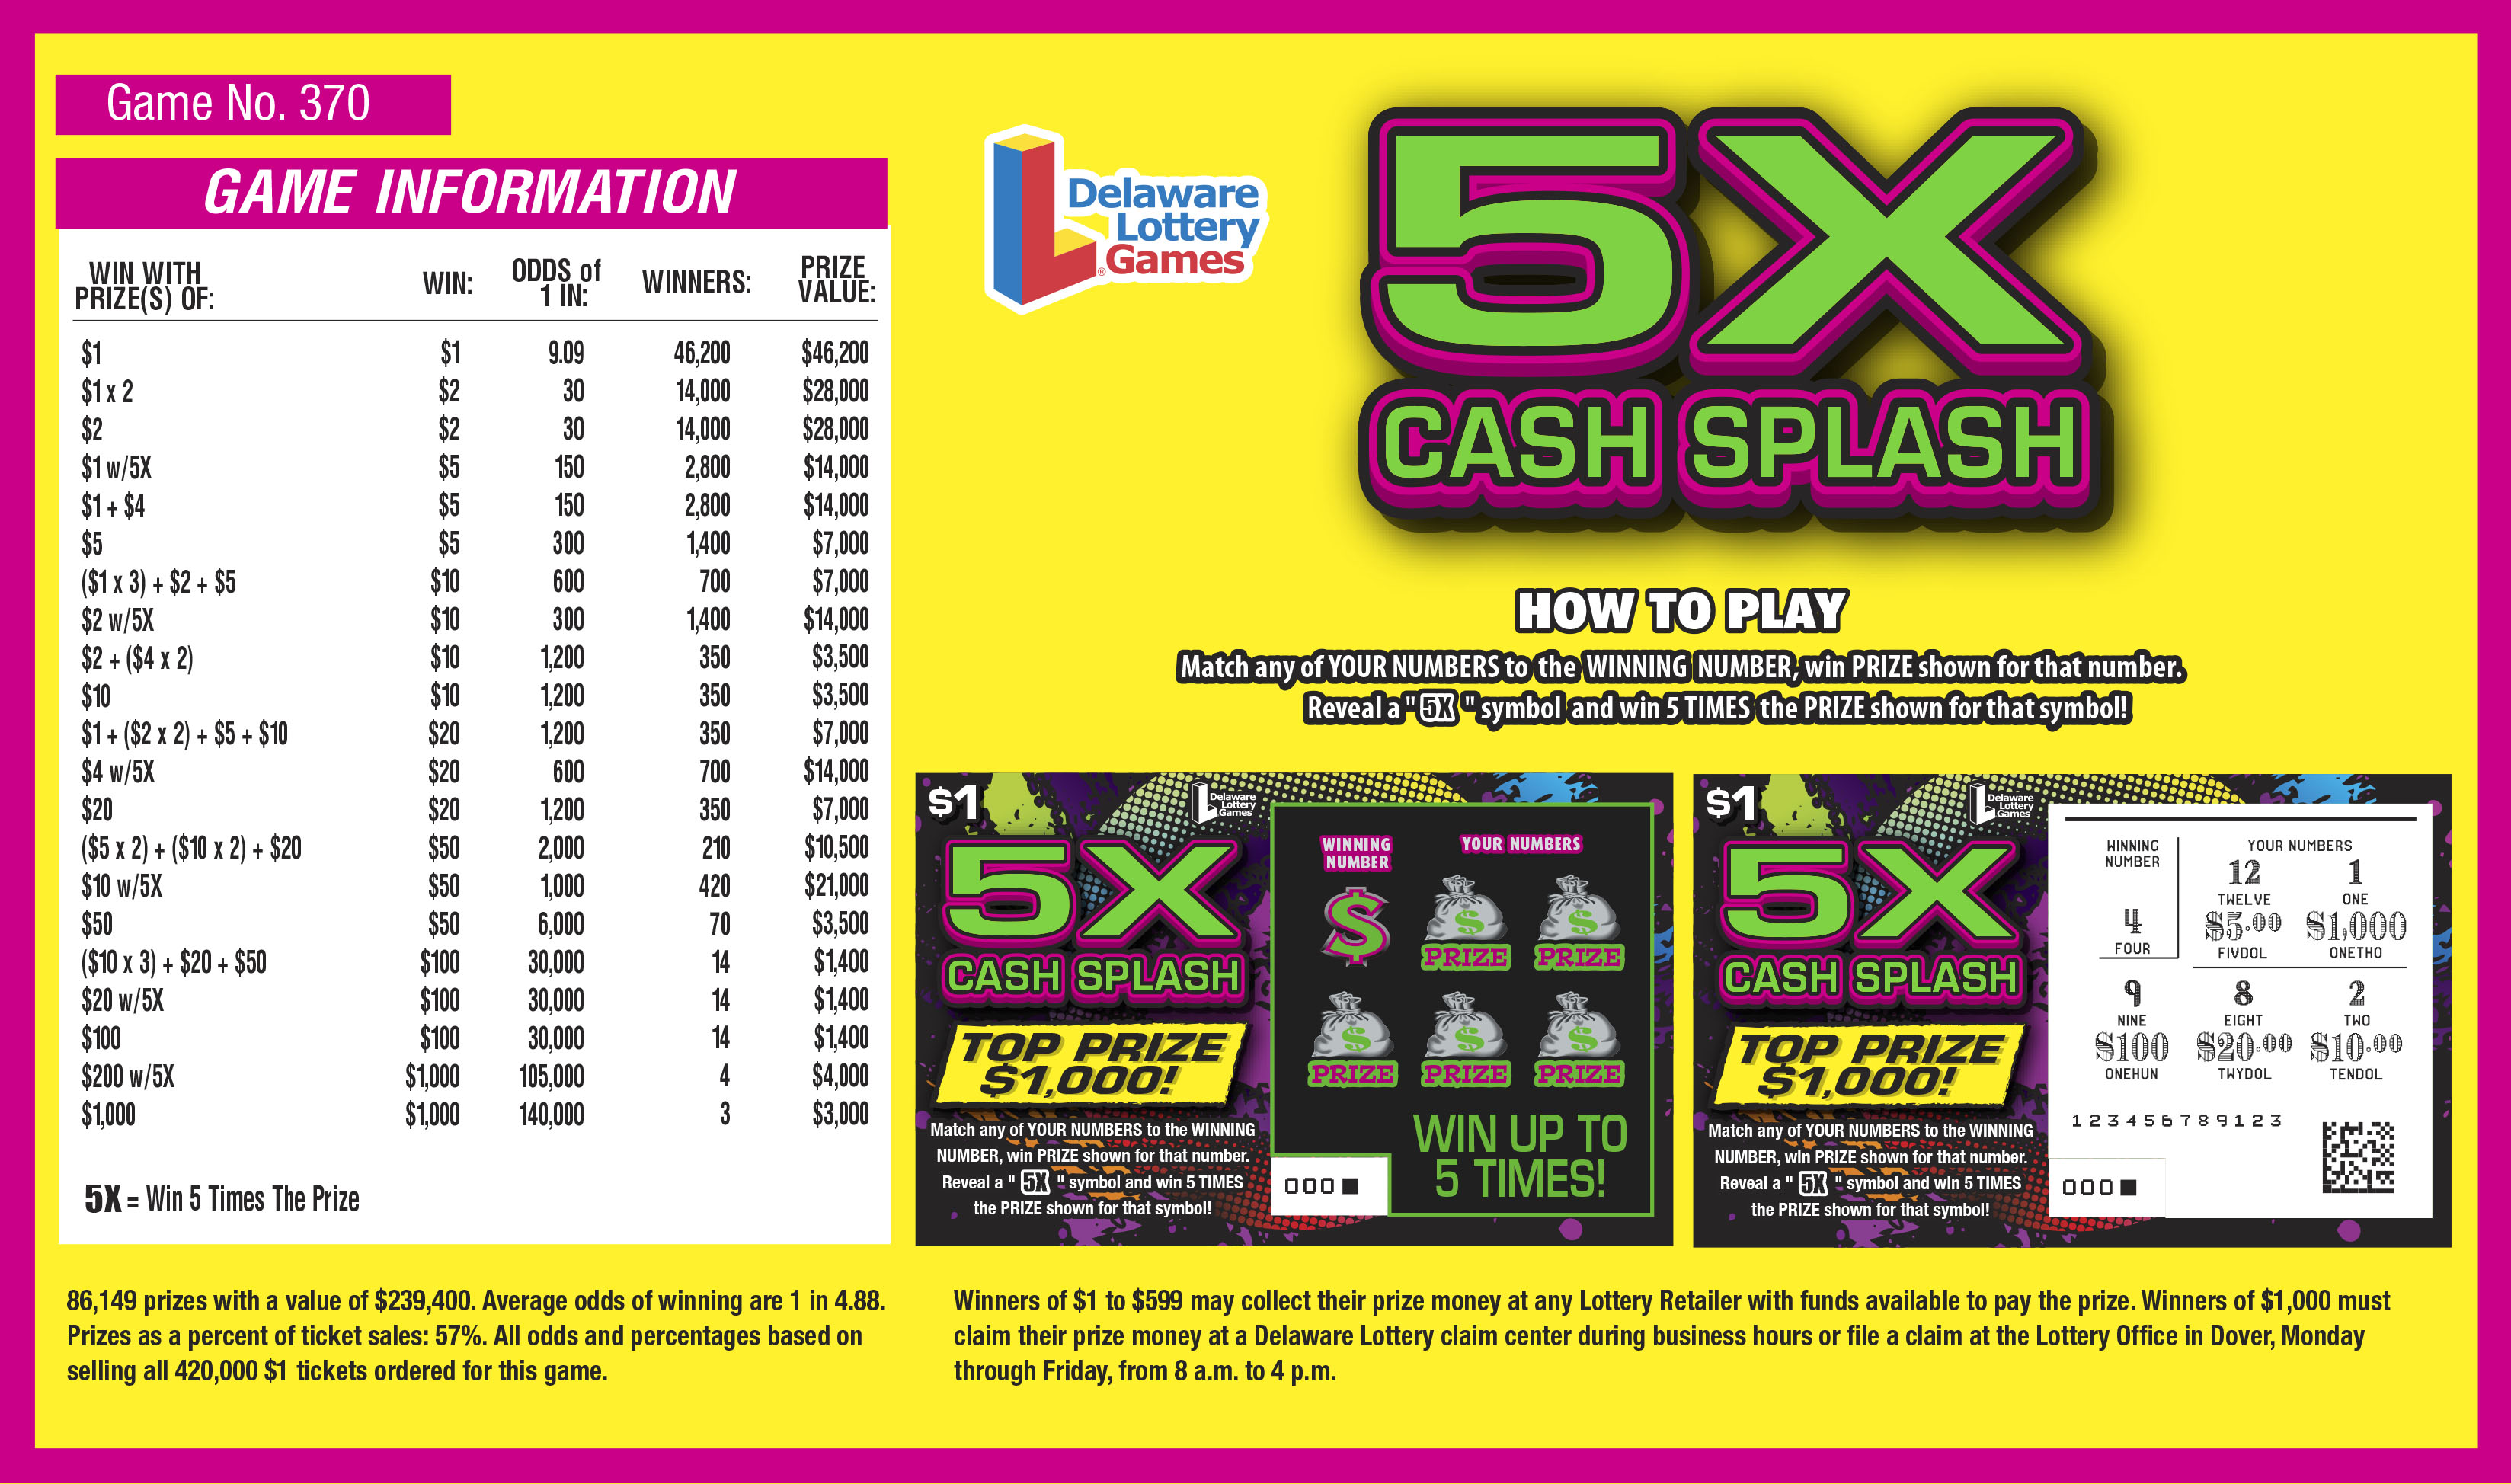
1. Check the scratcher prize odds first.
Many don’t realize it but the Virginia Lottery commission posts all the odds for each game on it’s website: https://www.valottery.com/scratcher-search. The website shows the overall odds for winning any prize along with the odds of winning the top prize. For this $30 scratcher game, that comes to 1 in 2.95 for any prize and 1 in 2,448,000 for the top prize of $5 million.
That means you can do the math and see whether it’s worth a higher cost for better odds of prizes that return more money. In comparison to that $30 per ticket scratcher game which has odds of 1 in 2.95 for winning $30 or more, this $1 scratcher game has odds of 1 in 5.05 of winning a prize of $1 or more. Additionally, the odds of winning the top prize for that game may be much better – 1 in 367,200 – but the top prize is only $1,777.
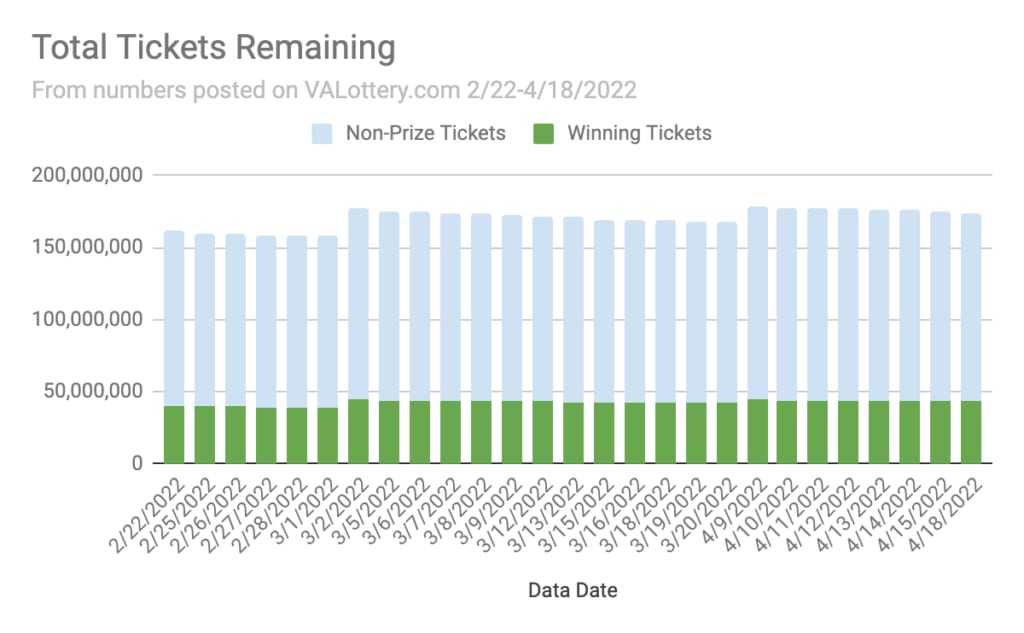
2. Check the number of remaining lottery scratcher prizes
While you’re looking at the scratcher game pages, you may have noticed the table showing the number of prizes remaining in circulation for that game along with the number of prizes distributed at the start of the game. Every seller of scratchers scans winning prizes into the Virginia Lottery system, so they know exactly how many prizes remain available to win. The VALottery.com website updates these counts daily.
While you may be just as likely to win a prize at any time, due to random disbursement of prizes among the rolls issued to sellers, logically it makes sense that fewer prizes in circulation = prizes are harder to find. The remaining prize counts will tell you if this scratcher game is more depleted than others.
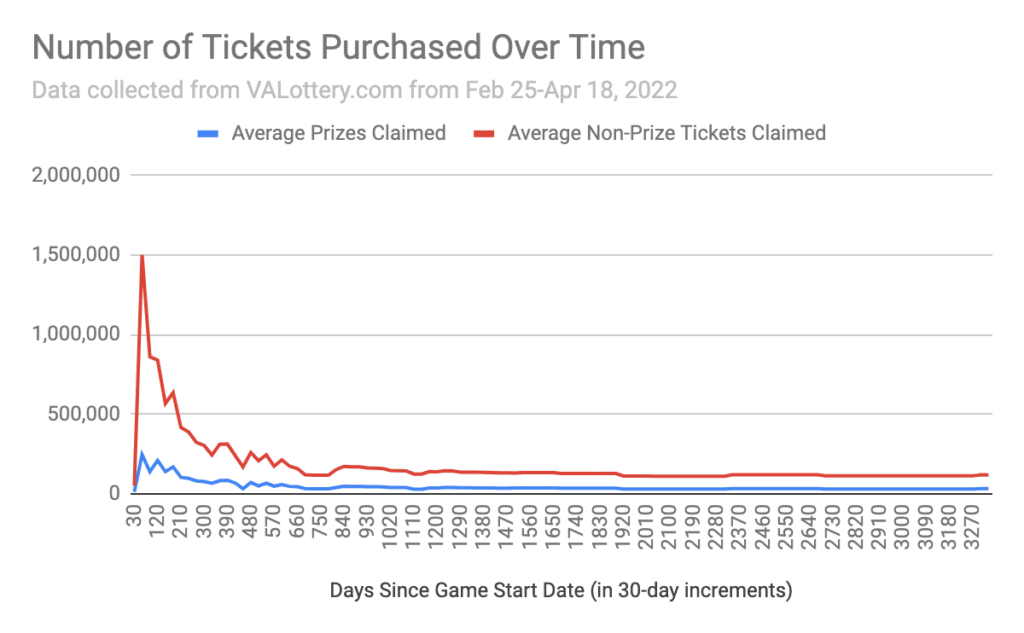
3. Check the current odds, not just the starting odds, from the number of remaining scratchers
Under number 1, I should have said you can check what the odds were at the start of game. You can calculate the current odds of winning any prize from the count of remaining prizes, if you do a little reverse math: total up the number of prizes remaining and multiply the sum by the overall odds to get the total number of scratcher tickets issued. Then divide the sum of prizes from that total of tickets issued.
Note that the overall odds never change – you used that number to calculate the total tickets issued, after all, and in theory all prizes are claimed equally over time. However, you can calculate the probability of landing any particular prize from the count of remaining tickets with that prize. AND you don’t have to rely on the outdated initial count of prizes issued; it can be accurate within the last 24 hours.
If that sounds like a lot of work, we’re here to help! Check out our list of current odds for all scratchers on our home page: scratcherstats,com. In fact we take it one step further – that list ranks the scratchers by the best current odds. See our Methods page for more details on the rankings by probability.
4. Don’t just check the probability of any prize, but the probability of winning prizes that return a profit
Winning a prize is always fun, but more often that prize will be for the amount of time you spent buying that ticket. Don’t get me wrong, I like getting money back, but I prefer getting a little something extra. That’s why you should calculate the probability of winning a profit, not just the probability of winning any prizes, from the number of prizes remaining. On our ranking list, we’ve factored that into the rankings. Find out more about how we compiled that ranking here.
The odds of a “profit prize” are lower than winning any prize, of course. For example, looking at the statistics we list for each Virginia scratcher, the average of winning any prize is 25%, while the average of winning a profit is 14%. But those odds of a profit range depending on the game, anywhere from 3% to 35%. If you plunk down cash for a scratcher, you’re going to want to get the one most likely to return some extra cash. That’s why you should use our list before buying.
5. Play the games with more prizes, not bigger prizes
If you’re following the tips above then you’re ready to play for more frequent small wins rather than rare big wins. Think of trying to find lots of coins buried in the mud with a few rare gold dubloons. If you aim to scoop up as many quarters, dimes, and nickels with the attitude that a big win would be nice but not expected, you may find yourself winning a pretty nice pot of change in the end.
6. Buy more than one scratcher at a time
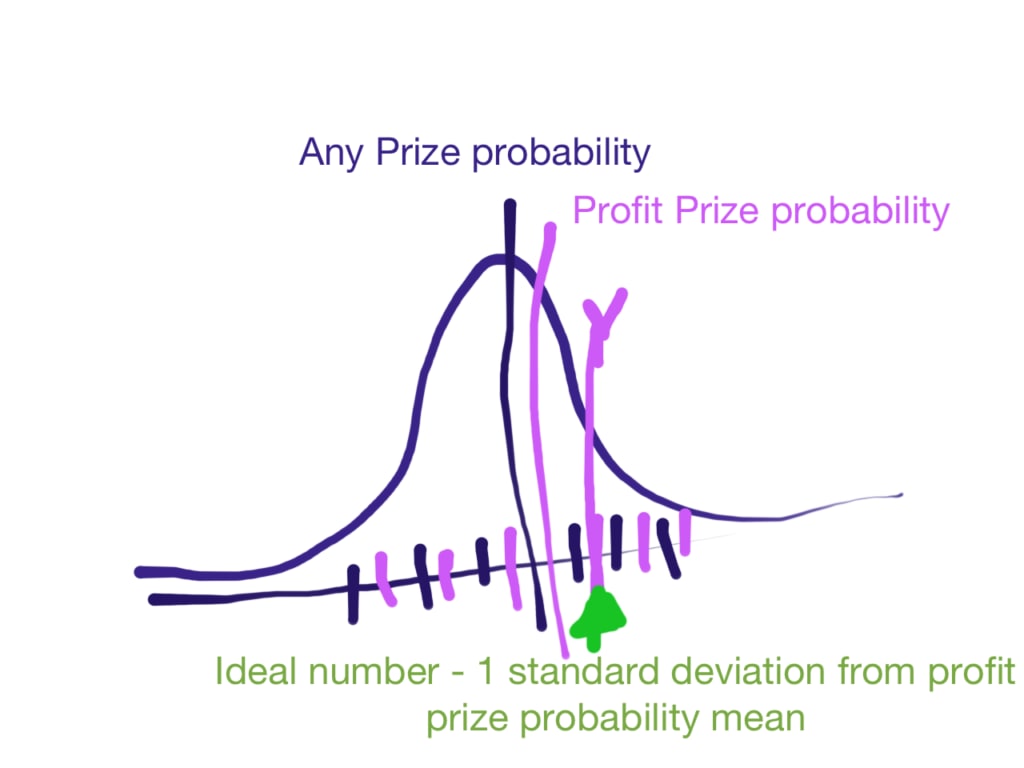
The heart of the best strategy when buying scratchers is this: buy a string of scratchers, ideally from the same roll. As explained in more detail here, the reason is that you maximize your chances by buying a number of scratchers most likely to contain a winning ticket. Along with calculating the probability of winning tickets from the number of remaining prizes presented on the website, you can can also calculate the standard deviation. Given the statistical laws of a normal distribution, you are 99.7% likely to turn up at least one winning ticket when purchasing a string of tickets equal to the odds of winning plus three standard deviations from a single roll of scratchers.
7. Buy only the number of scratchers you need to win a prize
Some people think buying a whole roll of scratchers will guarantee a big winner, or at least enough prizes to make some money over the amount spent on the roll. But according to the law of diminishing returns, that’s a waste of money. You’ll get a minuscule increase in odds by buying all those tickets. On the other hand, you can maximize your potential returns by buying a number of tickets equal to one standard deviation from the mean odds of a prize worth more than the cost of the ticket (i.e., mean “profit” prize odds + one standard deviation). Depending on the scratcher game, that means buying anywhere from 28 to just 4 tickets. The logic is explained in this blog post.
The ranking of scratchers provides a list of scratcher tickets with the best tradeoff between number of tickets to buy and probability of winning. Filter the list for the scratchers that require the least number of tickets in order to win a prize. Of a total 85 scratchers, there are 19 of which you need to only buy 10 tickets for the best odds of winning.
8. Take advantage of second chances
Many of the Virginia Lottery scratcher games have an “eXra Chances” logo on them. Scratch off that logo to find the scratcher serial number and you can enter to win a drawing every week for a prize worth anywhere from $500 to $1,000. The prize changes, of course: one week it’s a $600 home improvement gift card, and the next month they rotate to $1,000 gift card or $2,000 for appliances. Add to those opportunities another five scratchers with similar “Second Chances” games that you can enter for a prize drawing. In fact, if you keep an eye out, you might find these eXtra Chances in the trash.
9. Keep your losers for tax season
The IRS lets you deduct gambling losses from your winnings. If you do win, you’re going to want to keep all your winnings, of course. The way to do that is to take advantage of tax deductions. Doing so means you keep the government from claiming 24% of those winnings. Read this blog post for more details.


