Get Lucky
Tag: <span>New data</span>

Tag: New data

The Missing Scratchers Stats: States Not Included on the Site

ScratcherStats.com aims to provide lottery enthusiasts and scratcher players with the data tools to make the best choices when standing at the convenience store counter. And you can get this data on remaining prizes for many US states in the same place! Sure, you can look at the data on the official lottery commission websites, but here you get all the stats for each state – we do the math for you, so you can know exactly how many tickets to buy for the best odds of winning a profit.

Map of US states whose lottery scratch off data is included ScratcherStats.com or not.

However, you may have noticed that the map on the home page only shows a limited number of states. Much like with the lottery in general, many states offer scratch-offs while others do not. If they do offer lottery scratch-offs, then most state lottery commissions commit to being transparent and provide players with data on the number of prizes out there. Like casinos, lottery commissions know that players will keep playing if they get information to work with. But some states don’t put enough data for us to calculate the statistics. Some states block us from grabbing that data. 

For us to work with the data, we have three requirements: 

  1. The ability to automatically grab the data off the lottery’s website. 
  2. The overall odds of winning a prize, to calculate the total number of tickets issued.
  3. The number of remaining scratch prizes, to know the currents odds of winning after prizes are claimed.

Here’s three examples of states we couldn’t include on ScratcherStats.com:

No Odds Data – New Jersey

New Jersey is absent from ScratcherStats.com because the New Jersey Lottery Commission does not provide detailed information on the odds of winning for their scratcher games. Without this critical data, it is impossible to calculate the statistics that ScratcherStats.com relies on to provide users with valuable insights. We can’t tell you percent of prizes of the total remaining scratchers, because that calculation requires the odds multiplied by the total number of prizes. You might as well just go directly to the New Jersey Lottery website for what little data they offer.

Missing Data on Remaining Prizes – Colorado

Colorado is another state with incomplete data on the website. Colorado does provide the odds of winning for their scratcher games and the number of prizes at the start of a game. However, the Colorado lottery website doesn’t post updated numbers on remaining scratcher tickets with unclaimed prizes. Without that data, we can’t improve much on what’s already posted on the CO Lottery website.  We could only provide a list of the scratcher games with the best odds when the game started, which could have been months or even years earlier.

No Prize Numbers At All – Iowa and Wisconsin

Iowa’s lottery website provides some data on their scratch games, such as the overall odds per game and even the odds per prize. But the site offers neither the number of prizes remaining nor the number of prizes issued at the start of the game, nor even a total number of prizes issued. Thus, there’s no data to calculate scratch game statistics with.

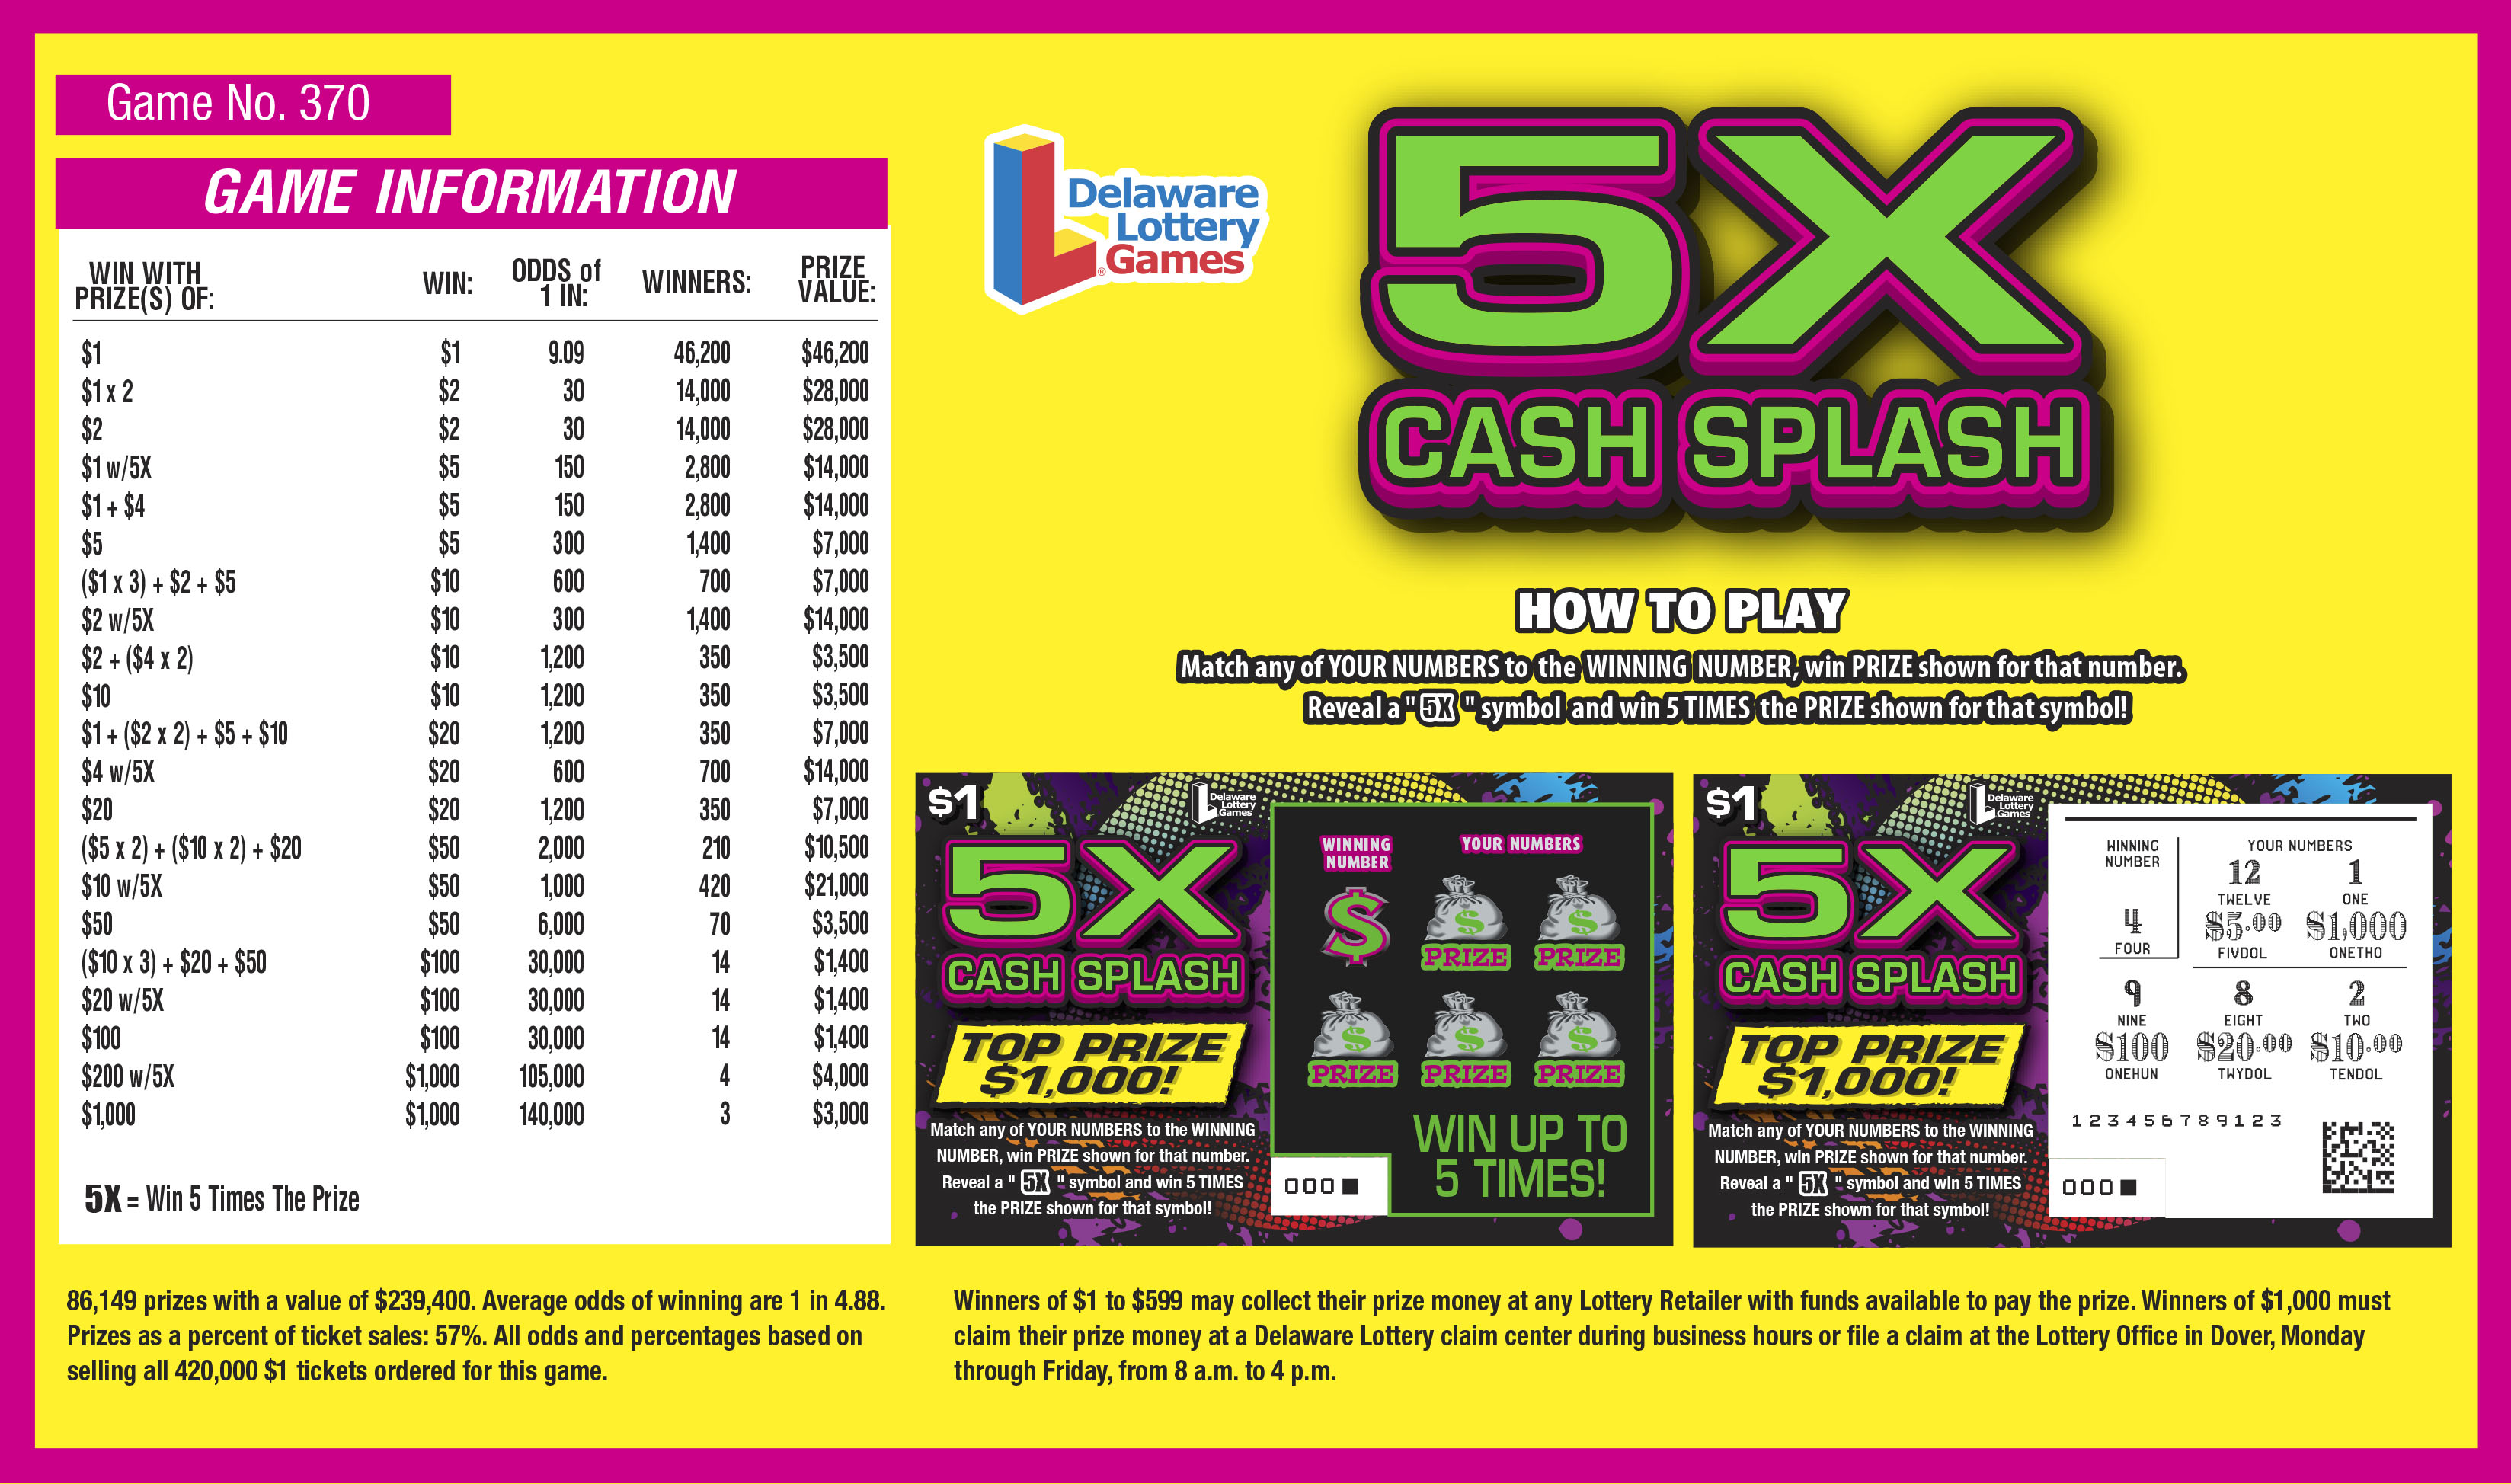
Lottery Data Locked in a JPEG or PDF – Delaware and Pennsylvania

Most lottery commission websites post the data in HTML tables, or within DIVs. Some make the data available within JSON format through API requests. However, Delaware posts their data within a picture. For each scratch off game, you can see the data within a jpeg format picture, like this. Did Delaware post the data for you to see? Yes. But can we easily get it to use for statistical calculations? Not so much. Maybe we’ll figure that out sometime. Likewise, Pennsylvania posts the data on remaining prizes for each scratch-off game in an HTML table, but only for the top six prizes! The rest of the data is in a PDF like this.

Data Gathering Restrictions – South Carolina

South Carolina’s lottery website implemented measures to prevent automated data scraping, making it challenging for websites like ScratcherStats.com to collect the necessary information. This technical obstacle has resulted in South Carolina’s exclusion from the website.

No Lottery Scratchers – Utah, Alabama, Nevada, Alaska, and Hawaii

Utah stands out as a state that does not offer lottery scratchers at all. Blame the legacy of the Church of Latter Day Saints in Utah, or the southern Baptist belt for Alabama. Nevada, with its thriving casino industry, has chosen not to introduce lottery scratchers to avoid competition with its established gaming sector. As a result, there are no scratcher games in Nevada to report statistics for on ScratcherStats.com. Other states that don’t offer the lottery at all include Alaska and Hawaii.

Weak Search Traffic – Montana, Idaho, Wyoming, North Dakota, Maine, Vermont 

These states are beautiful, and maybe that’s why Google Trends shows few to none search traffic for lottery scratch games – because people have too many other things to do. No matter whether using “scratchers”, “scratch off”, “scratch games”, these states don’t make the list on the Google Trends’ map. So we’d rather put the effort into data for states where there’s demand for data on the lottery scratchers with the best odds.

States Coming Soon

On a more positive note, ScratcherStats.com is continually working to expand its coverage. States like Michigan, Pennsylvania, Massachusetts, and Arkansas are expected to be represented on the website in the near future. The inclusion of these states will broaden the scope of data available to scratcher players and enthusiasts.

Conclusion

While ScratcherStats.com strives to provide comprehensive and up-to-date information on scratcher games across the United States, we’ll never be able to include every state due to the unavailability of data, technical restrictions, or unique state policies. However, the website continues to grow and evolve, with plans to include more states in its coverage, ensuring that scratcher players have access to valuable statistics to enhance their gaming experience.

Avoid Scratcher Games with No Top Prizes?

Would it be a good strategy to buy lottery scratchers when there are no top prizes remaining? Once the top prize is gone, the odds of winning it will be zero. Many state lotteries allow games to continue even if no one has a chance to win the top prize. But maybe the game offers still more prizes that you can win?

Some games may still offer many other prizes, and your odds of winning money haven’t changed with the handful of top prizes no longer in the pool. But realistically, if the $1 million prize is already taken, would you turn your nose up at a $50,000 prize?

Strategies for Winning Lottery Scratchers

There is no sure way to win money with lottery scratchers, as the outcome is determined by chance and the odds of winning vary for each game. However, some strategies that people use to increase their chances of winning include:

  1. Choose games with the best odds of winning, as different games have different odds of winning based on how many prizes have been claimed already.
  2. Look for scratchers with a higher payout ratio, the percentage of total sales that is returned to players as prizes.
  3. Buy multiple scratchers at once, as this increases your chances of winning.

How to Choose the Best Scratchers

This website helps you do numbers 1 and 2 – our scratcher game rankings help you choose the game to buy for the best odds, before you put your money down. The data we provide tells you which games no longer offer top prizes.

The normal distribution bell chart overlayed on scratcher tickets

For number 3, it’s up to you to buy the number you can afford. But we recommend you buy a string of tickets, as your strategy can take advantage of the statistical probability in a normal bell curve. You only need to buy enough tickets equivalent to two standard deviations from the mean probability of winning a profit prize. And you’ll have given yourself a 98% chance of landing at least one prize. Our rankings tell you exactly how many tickets that would be.

Should You Buy a Lottery Scratcher with No Top Prizes?

Back to the strategy of buying scratcher games with no top prizes remaining:

When top prizes are gone, the payout ratio, which is the percentage of total sales that is returned to players as prizes, can be lower. Lower payout ratios mean that less of the money spent on the scratchers goes back to players as prizes.

But again, don’t we only care whether we ourselves win a prize? I’ll take any prize as a win! Maybe these games can have better odds of winning something, over games where the top prize waits to be claimed.

As of this writing 1/28/2023, we post data for eight states and the District of Columbia. Here’s a breakdown of the average probability of winning a profit prize – more than the cost of the ticket – by state depending on whether the top prizes remain:

State No Top Prize Remaining Top Prizes Remaining
Arizona N/A 15.1%
California 11.3% 15.8%
DC 13.6% 15.8%
Maryland 12.9% 15.8%
Missouri 15.6% 12.8%
New Mexico 14.0% 15.9%
New York 12.6% 13.3%
Oklahoma 11.8% 14.2%
Virginia 15.1% 15.8%
Average Total 13.4% 14.9%

So in fact, your odds of winning a profit prize are better if the top prizes are still unclaimed. It may be that these are games still new to the public, and there are just more tickets remaining with any prize! For almost every state, the probability of winning more than you paid for the scratcher is higher than if the top prizes are gone.

The notable exception Missouri, where the odds of winning a profit prize are 2.8 percentage points higher for games with no top prizes than for games where the top prizes remain. If you live in Missouri, you may want to rank by those scratchers without top prizes.

It is a better strategy to check the odds of winning and the payout ratio before buying lottery scratchers. You can find this data on our scratcher rankings pages, one for each state. Also, set a budget and stick to it, gamble responsibly and within your means. Don’t spend more that you can pay within your paycheck.

Now Presenting – California Lottery Scratchers Statistics!

For a long time this website only offered data for lottery scratchers tickets in Virginia. It’s where we live, it’s where we tested out our math. Now, we’ve added tools for you to explore the best scratchers odds in California! Here you can find California scratchers ranked by the best probability of winning a prize, using statistics from the California Lottery website.

Image by Allexxandar on Freepik
Image by Allexxandar on Freepik

Just like with the Virginia scratch-off rankings, every day we gather data on the remaining prizes yet unclaimed posted on the official California Lottery website. We crunch that data down to a ranking by scratcher games with the best probability of winning a prize, the most available prizes, and the highest expected value. You can read more about the methodology here.

You may think that your best shot at winning money are the high profile California Lottery games like Mega Millions, Pick 3, or Powerball. But you’ll find much better odds of winning money if you buy a cluster of scratcher tickets, especially when picking games based on remaining prizes data.

The best strategy: buy as many tickets for one game recommended in “Max Tickets to Buy.” You’ll likely get you at least one winner! This number of tickets is two standard deviations from the mean, giving you a 98% chance of winning at least one prize, and maybe more.

Here’s a little tip for California – can enter your losing tickets on the California Lottery website for another chance to win when they draw winners for bonus prizes. Since you’re likely to get one winner, the rest in the cluster are chances to win another prize!

You can see each California scratcher game’s statistics here.

We’re adding new pages for each state in the United States, so check back again soon to see your home state!

Now Presenting – Maryland Lottery Scratch-Offs Statistics!

For a long time this website only offered data for lottery scratchers tickets in Virginia. It’s where we live, it’s where we tested out our math. Now, we’ve added tools for you to explore the best scratchers odds in Maryland. Here you can find Maryland scratch-offs ranked by the best probability of winning a prize, using statistics from the Maryland Lottery website.

Just like with the Maryland scratch-off rankings, every day we gather data on the remaining prizes yet unclaimed posted on the official Maryland Lottery website. We crunch that data down to a ranking by scratcher games with the best probability of winning a prize, the most available prizes, and the highest expected value. You can read more about the methodology here.

You may think that your best shot at winning money are the high profile Maryland Lottery games like Mega Millions, Pick 3, or Powerball. But you’ll find much better odds of winning money if you buy a cluster of scratcher tickets, especially when picking games based on remaining prizes data.

The best strategy: buy as many tickets for one game recommended in “Max Tickets to Buy.” You’ll likely get you at least one winner! This number of tickets is two standard deviations from the mean, giving you a 98% chance of winning at least one prize, and maybe more.

You can see each Maryland scratch-off game’s statistics here.

We’re adding new pages for each state in the United States, so check back again soon to see your home state!

Now Presenting – New York Lottery Scratchers Statistics!

For a long time this website only offered data for lottery scratchers tickets in Virginia. It’s where we live, it’s where we tested out our math. Now, we’ve added tools for you to explore the best scratchers odds in New York. Here you can find New York scratchers ranked by the best probability of winning a prize, using statistics from the New York Lottery website.

Just like with the New York scratch-off rankings, every day we gather data on the remaining prizes yet unclaimed posted on the official New York Lottery website. We crunch that data down to a ranking by scratcher games with the best probability of winning a prize, the most available prizes, and the highest expected value. You can read more about the methodology here.

You may think that your best shot at winning money are the high profile New York Lottery games like Mega Millions, Win 4, or Powerball. But you’ll find much better odds of winning money if you buy a cluster of scratcher tickets, especially when picking games based on remaining prizes data.

The best strategy: buy as many tickets for one game recommended in “Max Tickets to Buy.” You’ll likely get you at least one winner! This number of tickets is two standard deviations from the mean, giving you a 98% chance of winning at least one prize, and maybe more.

Here’s a little tip for New York – the New York Lottery website promotes another chance to win when they draw winners for bonus prizes. Since you’re likely to get one winner, the rest in the cluster are chances to win another prize!

You can see each New York scratcher game’s statistics here.

We’re adding new pages for each state in the United States, so check back again soon to see your home state!

Now Presenting – Oklahoma Lottery Scratchers Statistics!

For a long time this website only offered data for lottery scratchers tickets in Virginia. It’s where we live, it’s where we tested out our math. Now, we’ve added tools for you to explore the best scratchers odds in Oklahoma. Here you can find Oklahoma scratchers ranked by the best probability of winning a prize, using statistics from the Oklahoma Lottery website.

Image by Allexxandar on Freepik. Link to page with the rankings of Oklahoma scratchers with the best odds
Image by Allexxandar on Freepik

Just like with the Virginia scratch-off rankings, every day we gather data on the remaining prizes yet unclaimed posted on the official Oklahoma Lottery website. We crunch that data down to a ranking by scratcher games with the best probability of winning a prize, the most available prizes, and the highest expected value. You can read more about the methodology here.

You may think that your best shot at winning money are the high profile Oklahoma Lottery games like Mega Millions, Pick 3, or Powerball. But you’ll find much better odds of winning money if you buy a cluster of scratcher tickets, especially when picking games based on remaining prizes data.

The best strategy: buy as many tickets for one game recommended in “Max Tickets to Buy.” You’ll likely get you at least one winner! This number of tickets is two standard deviations from the mean, giving you a 98% chance of winning at least one prize, and maybe more.

Here’s a little tip for Oklahoma – the Oklahoma Lottery website promotes another chance to win when they draw winners for bonus prizes. Since you’re likely to get one winner, the rest in the cluster are chances to win another prize!

You can see each Oklahoma scratcher game’s statistics here.

We’re adding new pages for each state in the United States, so check back again soon to see your home state!