We’ve shipped two of the biggest changes to ScratcherStats since launch: the ranking system that decides which lottery scratchers have the best odds is now driven by full Monte Carlo simulations, and there’s a new Scratcher Trends page that tracks how the remaining prizes on every scratch off change over time. If you came here looking for the best scratch offs to buy, the scratchers with the best odds, or how to check remaining prizes on lottery scratchers, this update is for you.
What changed in the rankings
Previously the ranking on the home page and on each state page (Virginia, Texas, California, Florida, and the other 22 states we cover) was based on a static probability calculation: take the remaining profit-prizes, divide by the remaining tickets, sort. That works, but it ignores variance — two games with the same headline odds can have very different real-world payout patterns once you actually start buying tickets.
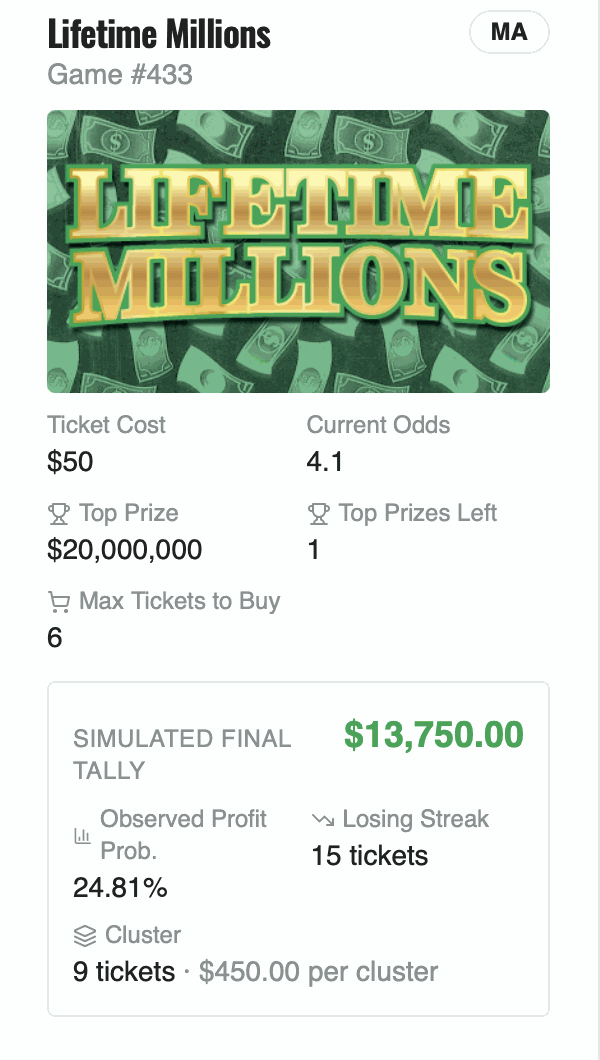
The new ranking runs a Monte Carlo simulation against every active scratch off every night. For each game we simulate 500 tickets drawn in 20–50 clusters from the live remaining-prize distribution, then score the game on:
- Simulated probability of winning a profit prize (a prize strictly greater than the ticket cost — break-even is a loss).
- Expected longest losing streak.
- Final simulated tally (cash in vs cash out).
- A composite score that combines all three.
The home page sort dropdown now lets you pick which of those you care about. The default “Best overall” uses the composite. If you’re asking which lottery scratchers win the most or which scratch off has the best odds in your state, that ranking is the answer we’d give — and it now updates nightly from the latest remaining-prize data pulled from each official state lottery site.
Why simulations instead of raw odds
Raw posted odds tell you what the lottery designed. They don’t tell you what’s likely to happen to you when you walk into a store and buy ten tickets. Two $5 scratchers can both advertise “1 in 3.5 overall odds” and have wildly different payout shapes once most of the top prizes are gone. The simulation captures that. It’s also why the rankings can shift day to day even when the headline odds on the lottery’s own site haven’t moved — prizes get claimed, the distribution shifts, and the simulation reacts.
If you want the gory details, our scratcher methods page walks through the simulation logic, the clustering, the profit definition, and how the composite score is built. The Python reference implementation is the authoritative source for the math.
See the simulated cluster results for any game
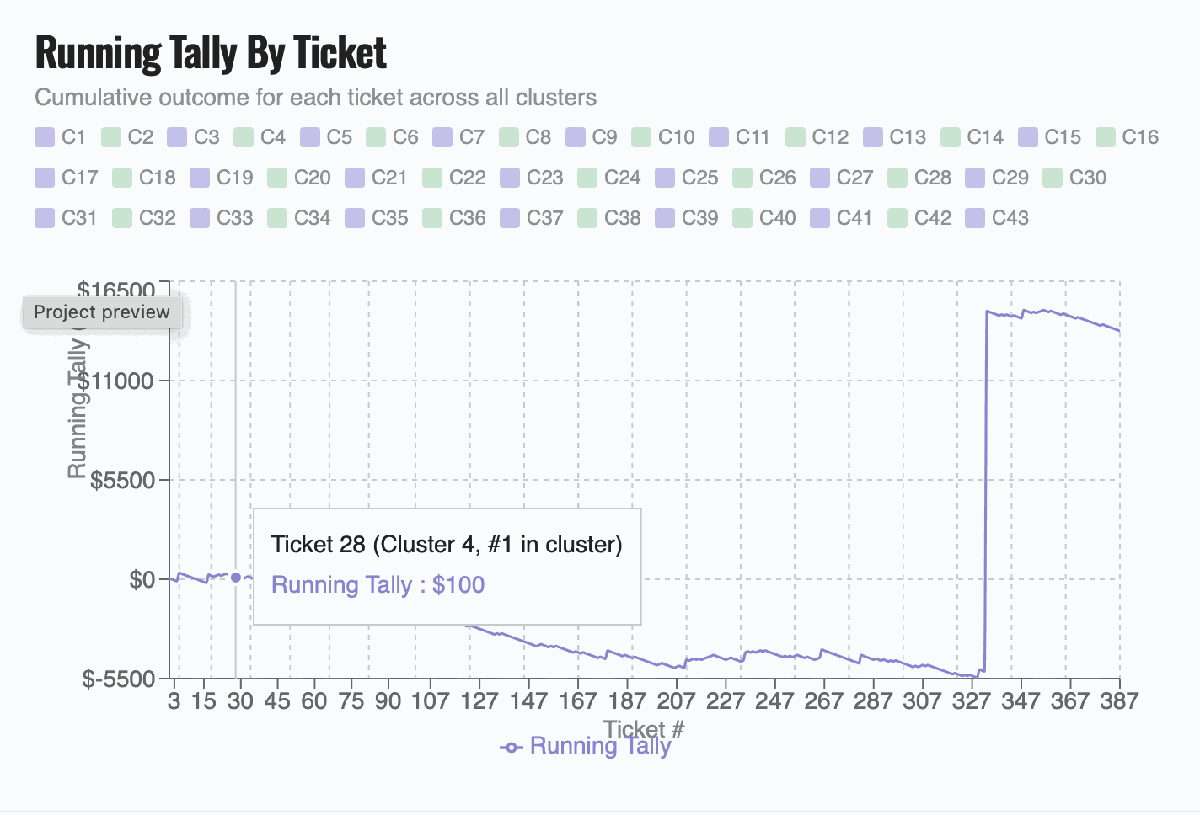
Every game now has a full simulation breakdown on its detail page, and there’s also a dedicated Simulations page where you can run and explore the cluster results yourself. Each chart shows the 20–50 simulated buying clusters for a game — how often a cluster ended in profit, how deep the losing streaks ran, and where the final tally landed across 500 simulated tickets. It’s the easiest way to see why a game ranks where it does, not just that it ranks there.
The new Scratcher Trends page
The other big addition is /trends. Every night we snapshot the remaining-prize counts for every active scratch off in every state we track and keep 30 days of history. The Trends page lets you:
- See how the probability of winning a profit prize on a specific game has changed over the last month.
- Spot games where the top prizes were just claimed (and the math suddenly got worse).
- Spot games where the remaining-prize ratio is trending up because losing tickets are getting bought faster than winners — these are the ones worth watching.
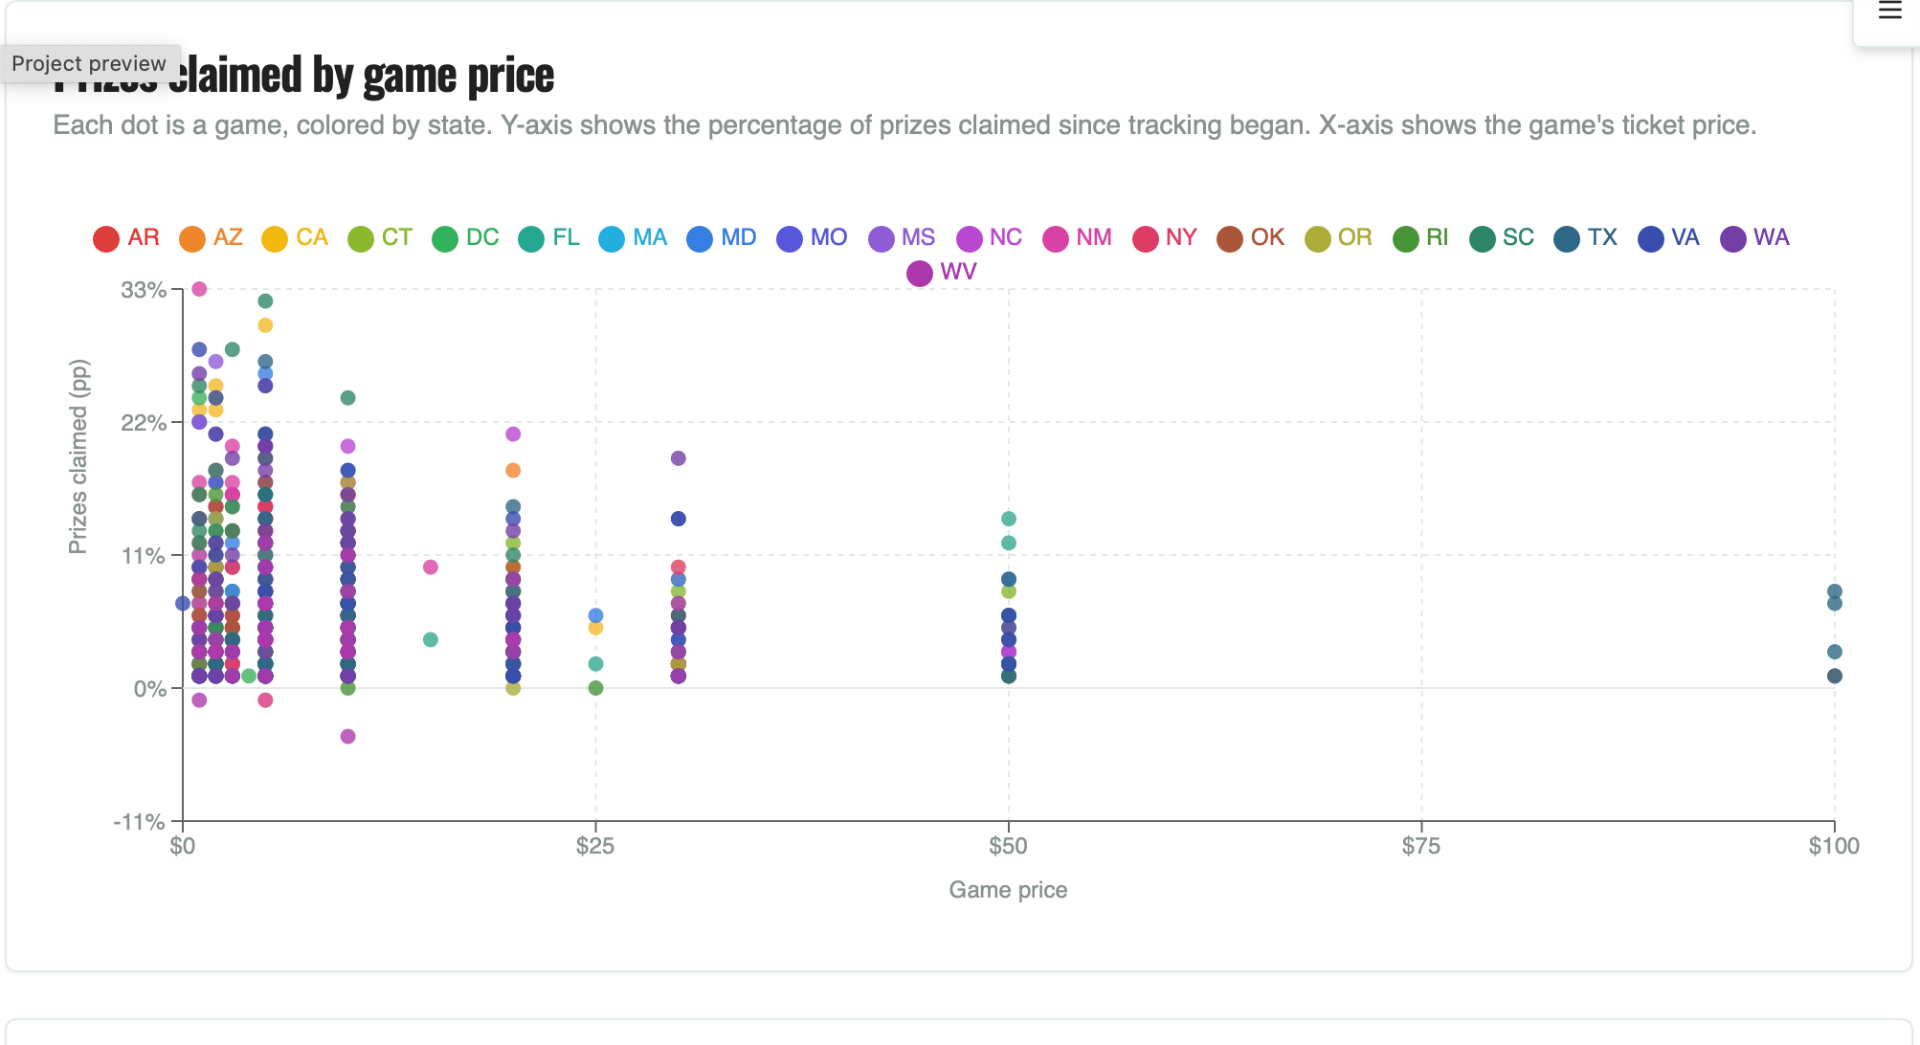
This is the closest thing we can offer to a lottery scratcher tracker without a physical scanner. We can’t scan your ticket, but we can tell you whether the game you’re about to buy has been getting better or worse to play over the last 30 days.
State coverage
We currently pull data for 26 states, including the heavy hitters: Virginia, Texas, California, Florida, New York, Pennsylvania, Georgia, North Carolina, Massachusetts, Michigan, Ohio, Arizona, Tennessee, Missouri, Indiana, Kentucky, and more. Each state has its own ranked page — e.g. best Virginia lottery scratch offs, best Texas scratch offs, best California scratchers — and each game has its own detail page with the full simulation breakdown.
How to use the new rankings
- Pick your state from the map on the home page or click your state above.
- Filter by price tier ($1, $2, $5, $10, $20, $30). If you’re looking specifically for $30 scratch off odds or $5 scratchers with the best odds, the price filter does that.
- Sort by “Best overall” for the composite, or by lowest losing streak if you want to minimize the dry spells.
- Click into any game to see the simulation distribution, the optimal bankroll calculation, and the 30-day trend chart.
What’s next
We’re working on price-tier landing pages per state, more states (the gaps are mostly states whose lotteries don’t publish machine-readable remaining-prize data), and longer trend history. If your state isn’t covered or you spot a game where the data looks off, let us know.
Reminder: scratchers are gambling. The simulations and rankings on this site are about relative odds — they help you pick the better of two bets, not turn a losing game into a winning one. If gambling is causing problems, the National Problem Gambling Helpline is 1-800-522-4700.